(paper accepted by Travel Behaviour and Society with minor revision)
The COVID-19 pandemic has had a significant impact on urban mobility. While numerous studies highlighted socioeconomic disparities, few have paid attention to the moderating role of the built environment in shaping those changes.
To fill the gap, this paper investigates associations between the morphological features of the built environment and changes in population mobility patterns during the pandemic. We used SafeGraph’s travel data to Point of Interest (POI) sampled from 2019 to 2021 in Fulton County, Georgia to quantify mobility patterns at the census tract level.
Through Principal Component Analysis and Factor Analysis, we extracted four key urban form features: density, connectivity, diversity, and centrality from a list of 12 raw built environment variables.
Results of the Ordinary Least Square (OLS) and spatial regression models indicated a significant relationship between the built environment and mobility changes in average travel distance and trip frequency per capita, suggesting that density, diversity, and connectivity features of the built environment can have a protective effect on urban mobility. In summary, this research enhances the understanding of the relationship between the built environment and population mobility patterns during the COVID-19 pandemic. These findings are useful for urban planning and public health, in which particular attention should be paid to suburban low-income neighborhoods as the most vulnerable group facing both socioeconomic and built environment disparities in public health crises. In addition, higher densities and mixed-use developments can also serve as effective strategies for urban planners and designers to strengthen urban mobility resilience in the future.
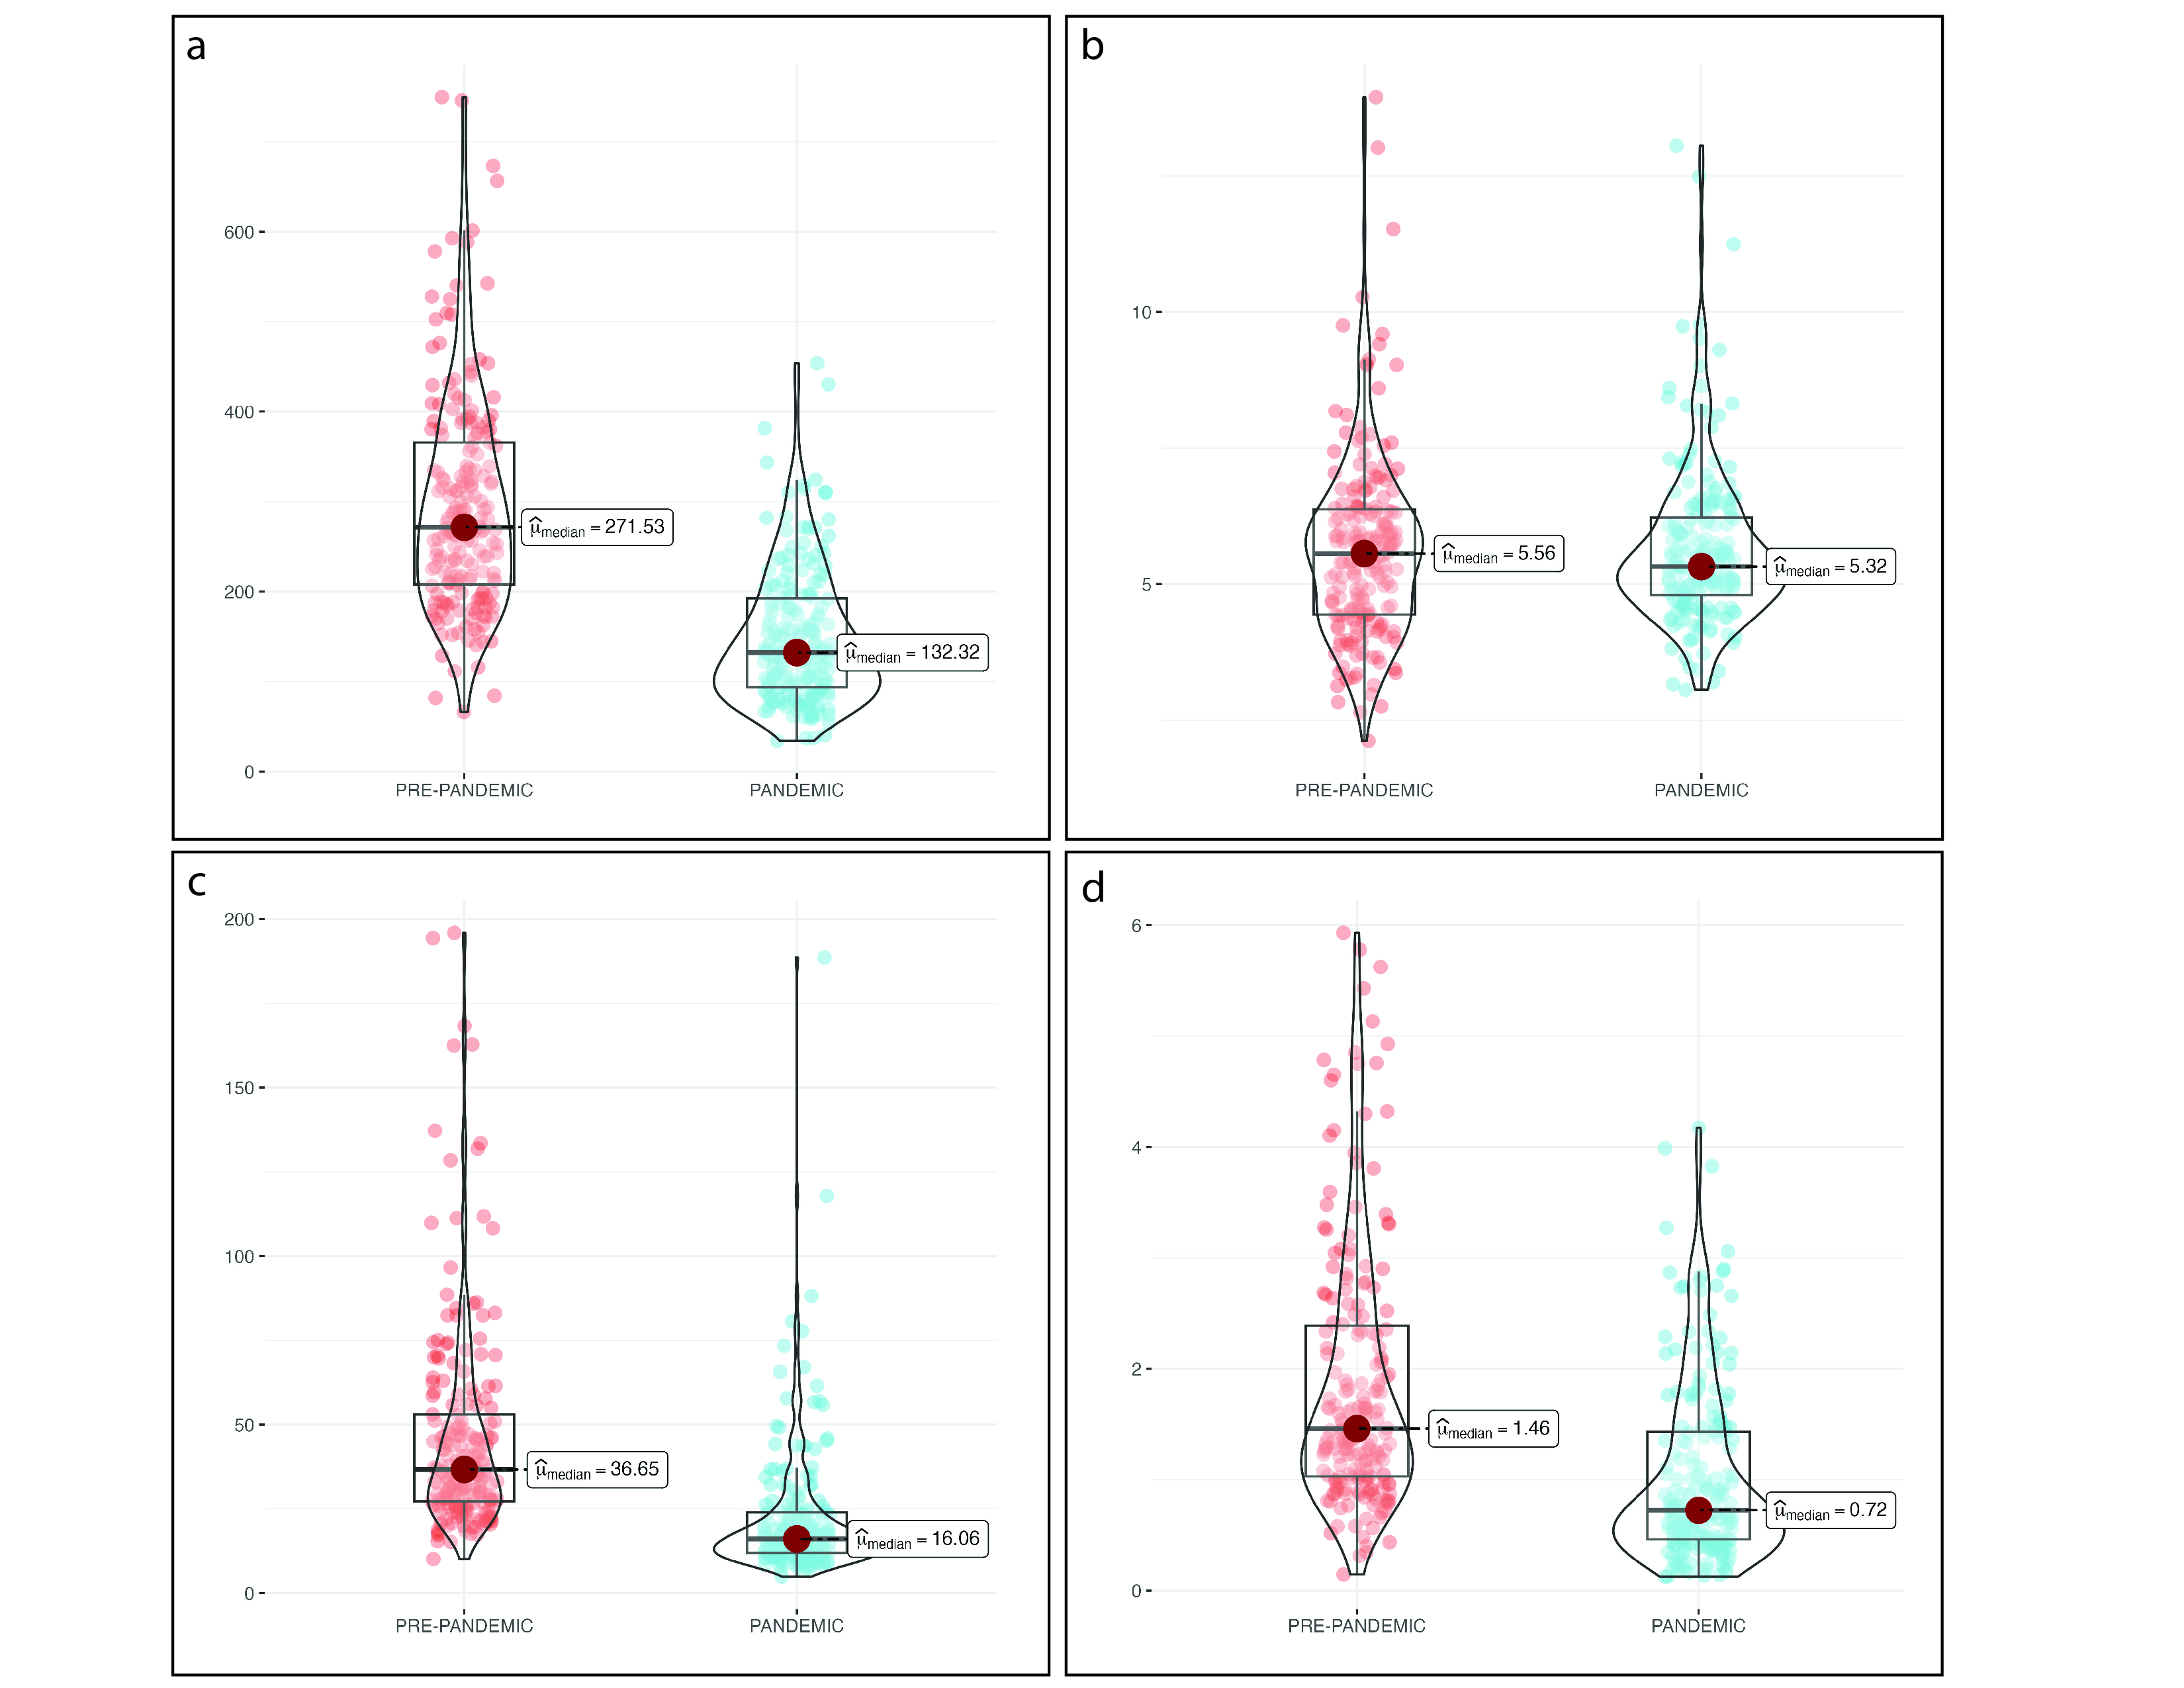
We found statistically significant difference in three of the four variables: travel frequency per capita (p < 0.001, 99% CI = [119.1, 170.4]), % of park trip (p < 0.001, 99% CI = [17.1, 31.4]), and % of healthcare facility trip (p < 0.001, 99% CI = [0.53,1.10]). The median travel frequency per capita decreased from 271 in pre-pandemic to 132. Correspondingly, the % of park and healthcare trips both decreased to half of the pre-pandemic level. The median average distance in the pandemic period was 0.34 miles shorter than the pre-pandemic period (5.32 miles), where the difference was not significant.

Fig.1 Boxplots of mobility outcome levels in the pre-pandemic and pandemic periods. a. Travel frequency per capita; b. average home-to-destination distance; c. % of trips to park POI; d. % of trips to healthcare facility POI
2. Associations between urban form, socioeconomic status, and mobility changes
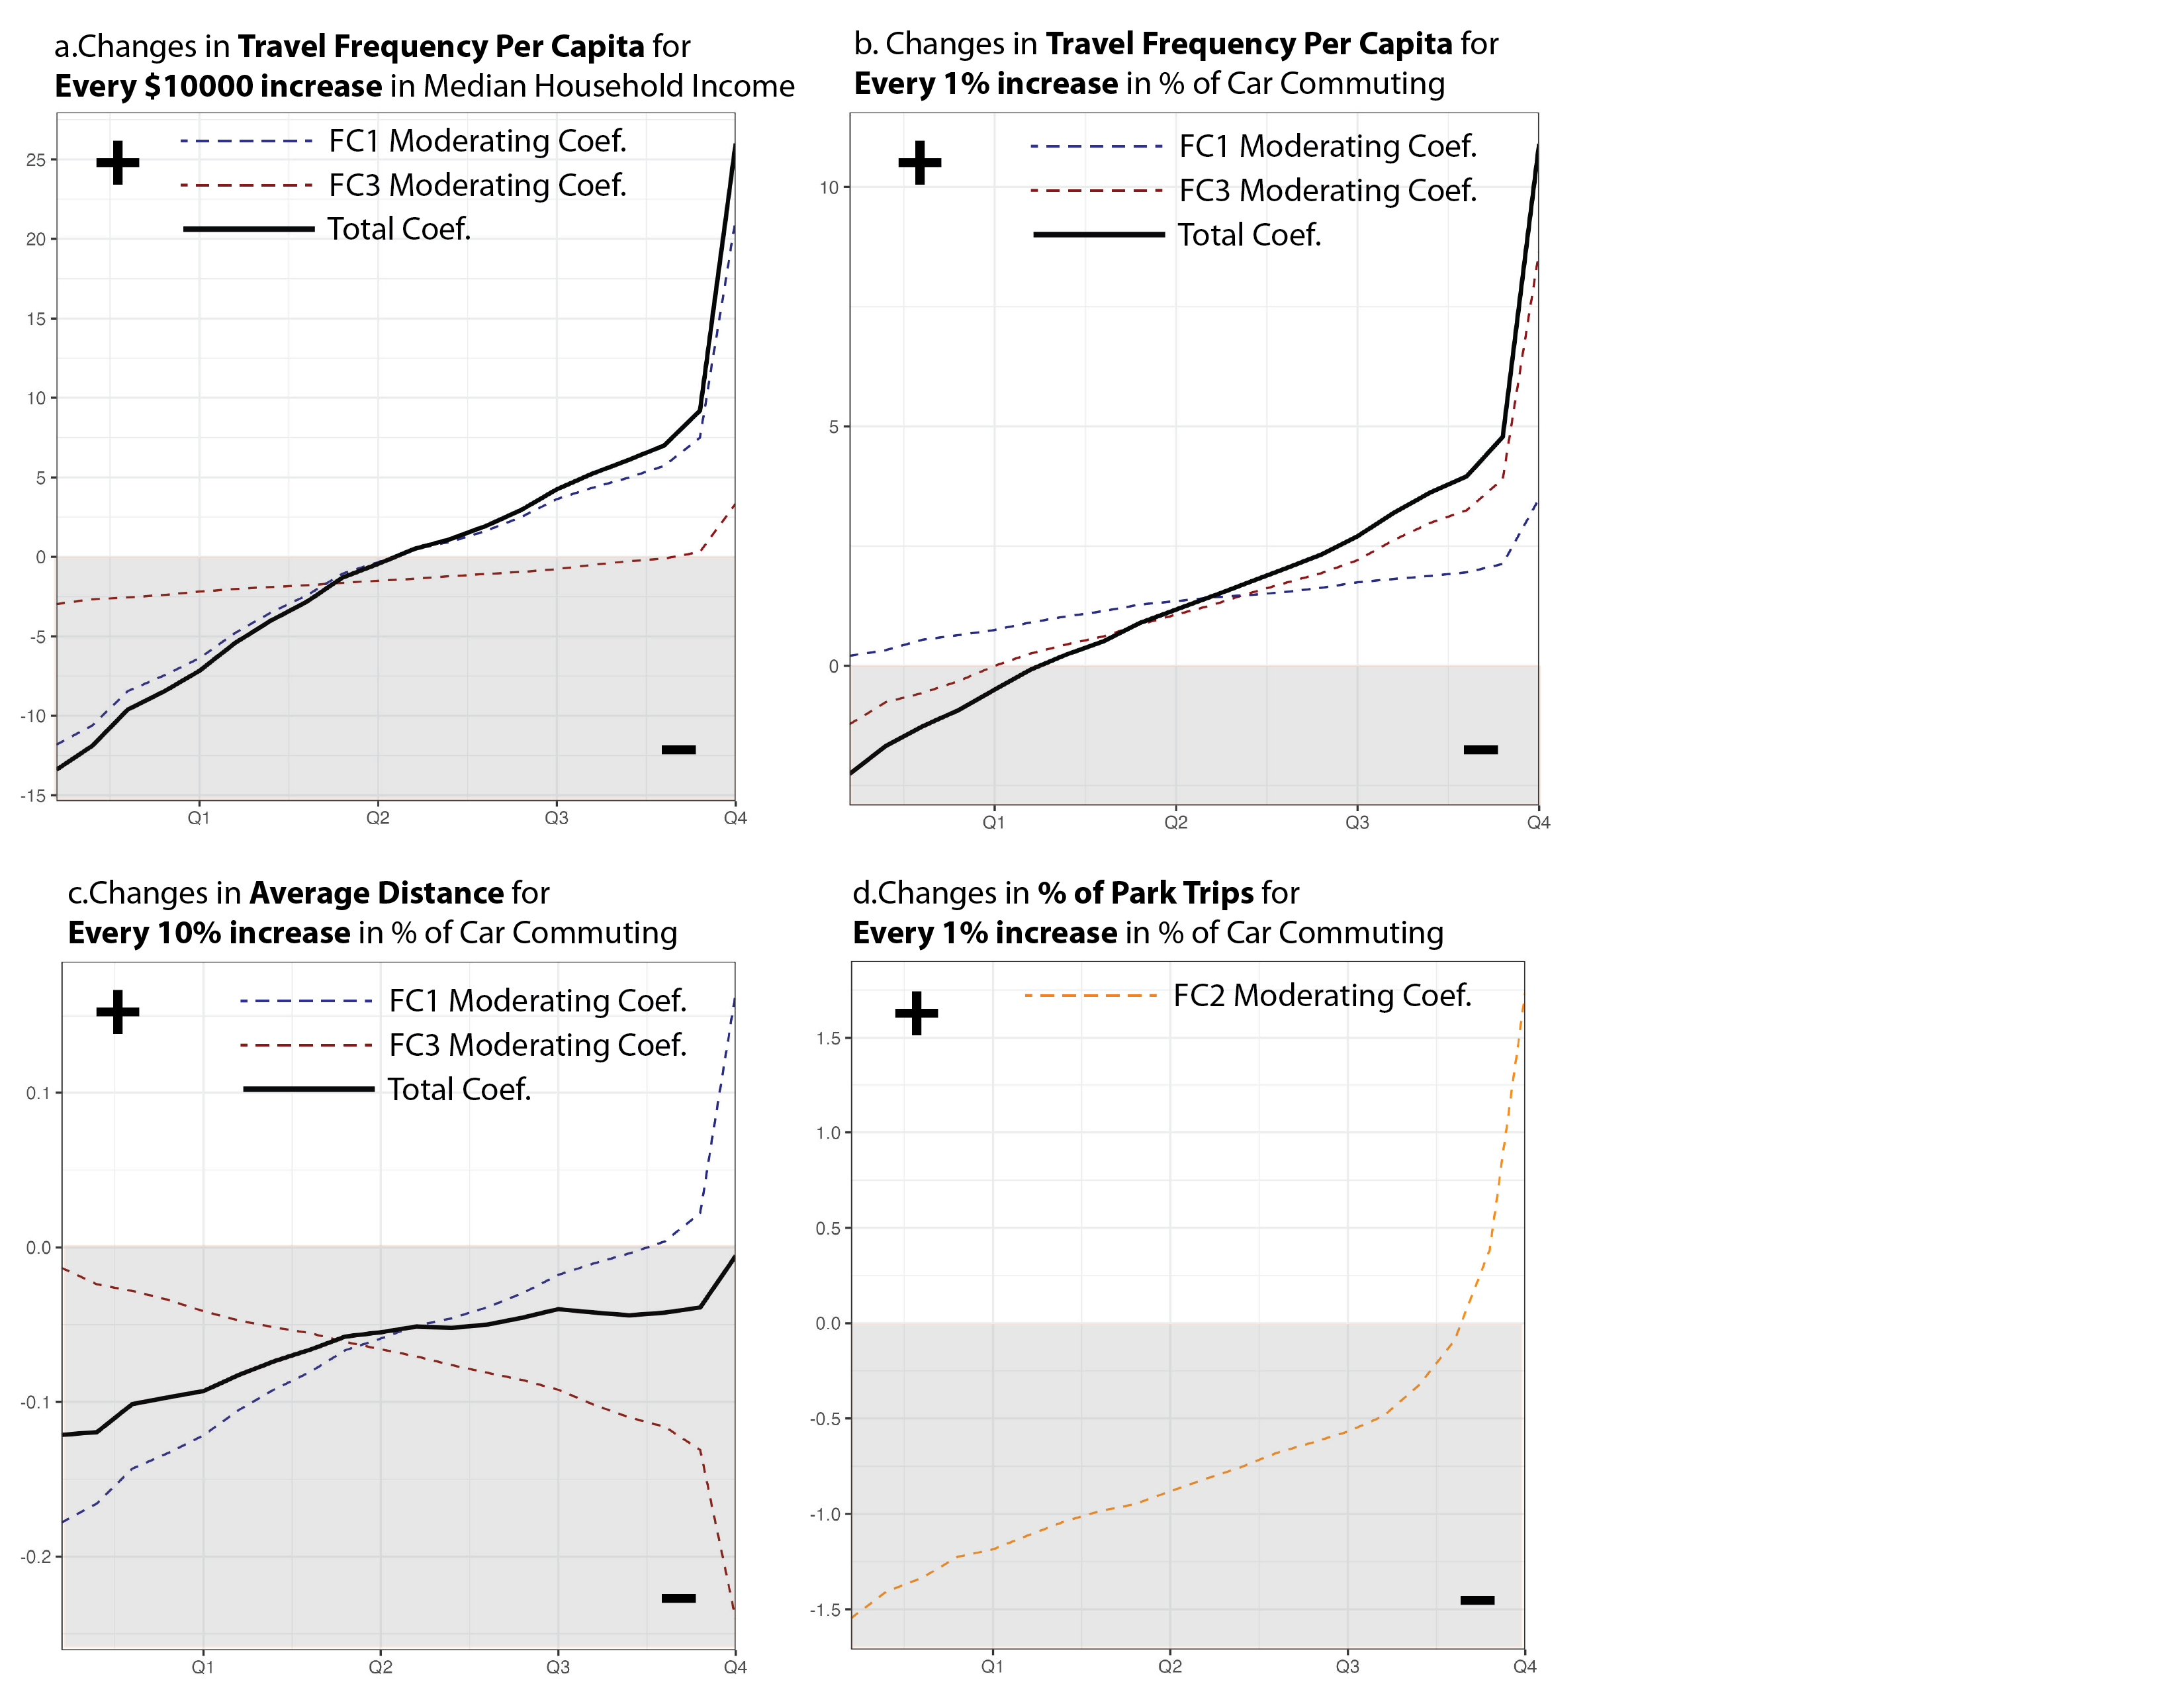
Both density (FC3) and connectivity (FC1) can reduce the effect of household income and car commuters on the disparity of travel frequency and home-to-destination distance. Income becomes a less important factor of travel frequency for residents living in census tracts with higher density and connectivity because of the high level of availability and accessibility to essential amenities.
Meanwhile, census tracts with higher density and connectivity Diversity (FC2) encourages higher percent of park trips both as independent effect and interactive effect with car commuting for similar reasons. Access to parks is often a scarce resource for households relying on public transit. This negative effect can be mitigated by living in higher density and diversity neighborhoods where the accessibility to the nearest parks can be less dependent on motor vehicles.

Fig.2 . Sensitivity of unit change of socioeconomic variables under the moderation of urban form metrics